[AWS まとめ]
2023年1月16日更新
このページではAWS 上のEC2でメモリ使用量のパーセントをチェックする設定の方法を紹介します。CloudWatch Agent のインストール、設定から詳細モニタリング、アラームの作成、テスト方法まで紹介しています。
(1)ロール
監視サーバにアタッチするロールを作成。(例:EC2-CloudWatch)
以下のロールを追加。
・CloudWatchAgentAdminPolicy
・AmazonSSMManagedInstanceCore (AmazonEC2RoleforSSMは権限が多すぎるため、代替にAmazonSSMManagedInstanceCoreが推奨されている)
(この設定を行えば、後でのアクセスキーの設定は不要)
(2)アタッチ
このポリシーをEC2インスタンスにアタッチ。
(3)EC2で CloudLog agent をインストール(あるいはSSM からインストール)
(4)config ファイル作成用の wizard を実行
C:\Program Files\Amazon\AmazonCloudWatchAgent\amazon-cloudwatch-agent-config-wizard.exe
(5)SSM から run コマンド実行
AmazonCloudWatch-ManageAgent
アクション「configure」
optional configuration parameter「ssm」
optional configuration location「AmazonCloudWatch-windows」(amazon-cloudwatch-agent-config-wizardで指定したもの、分からなくなったらパラメータストアで確認)
「インスタンスを手動で選択」でインスタンスIDを指定することにより、実行するインスタンスを識別します。
数秒で完了します。「詳細なステータス」が「成功」になれば成功です。(「インスタンスIDが含まれません」というのはエラーです。)
(6)Windows サービス
インスタンス側は以下サービスで処理が行われる。自動で開始されるので特に設定は不要。
AmazonCloudWatchAgent
(メモ)マネージメントコンソールで詳細モニタリングを有効にしたくても取得できた(確認中)
以上でAWS マネージメントコンソールのCloudwatch で仮想メモリの使用率を取得することが可能となります。
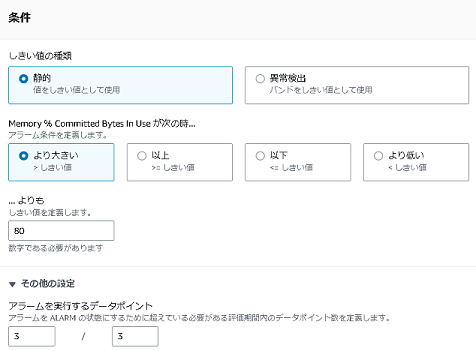
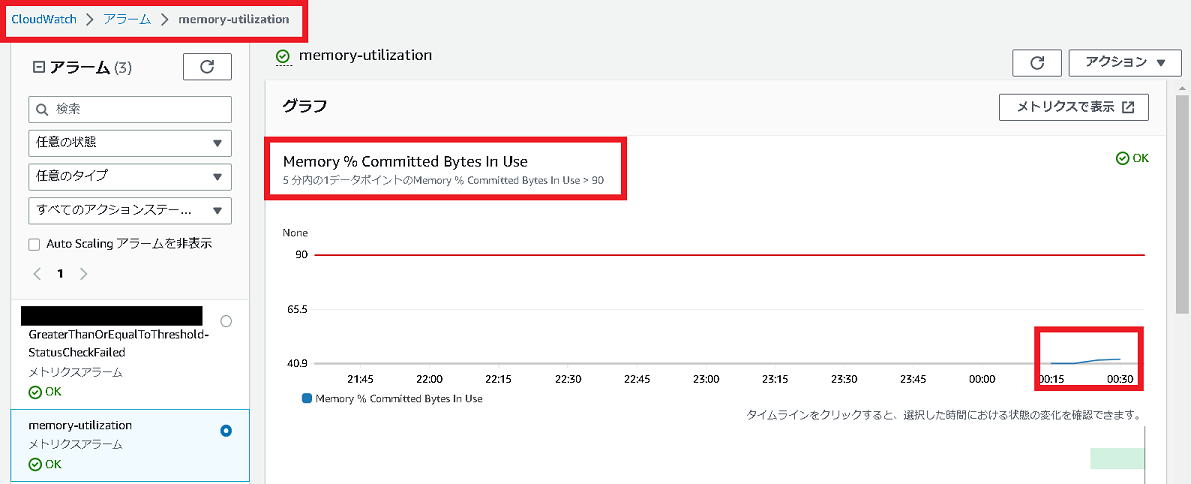
以下の例ではMemory utilization のアラームを作成し閾値でチェックしています。
以下は正常時のアラームの状態
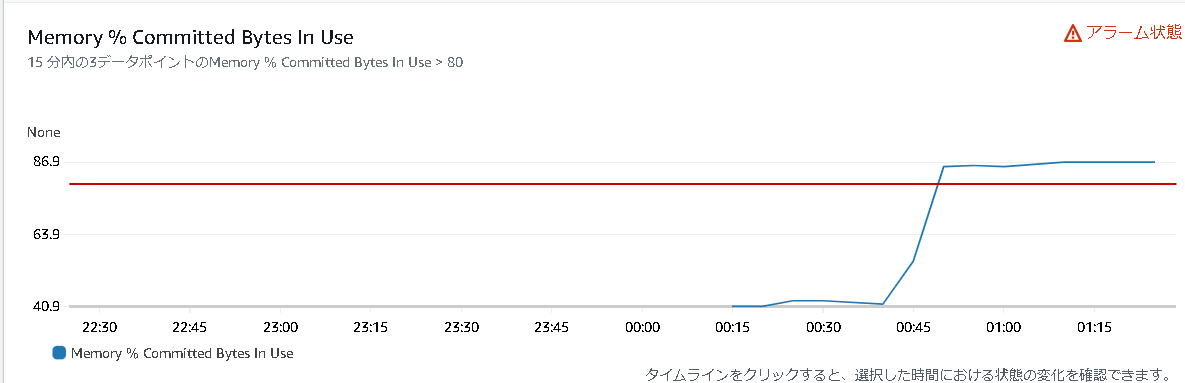
その後EC2上でペイント(mspaint.exe)を起動。例えば10000 x 7000 サイズで 24bit のbmp形式でファイルを作成します。bmp
は非圧縮なのでメモリを圧迫します。(png 形式は圧縮するのでNG)
memory utilization は次の通り一気にアップします。アラームを設定している場合はアラームが通知されます。
その後mspaint を終了するとメモリ使用量も下がり、アラームも自動的に「正常」に戻ります。
参考:CloudWatch agent predefined metric sets
https://docs.aws.amazon.com/AmazonCloudWatch/latest/monitoring/create-cloudwatch-agent-configuration-file-wizard.html
以下実行例です。
C:\Program Files\Amazon\AmazonCloudWatchAgent>amazon-cloudwatch-agent-config-wizard.exe ================================================================ = Welcome to the Amazon CloudWatch Agent Configuration Manager = = = = CloudWatch Agent allows you to collect metrics and logs from = = your host and send them to CloudWatch. Additional CloudWatch = = charges may apply. = ================================================================ On which OS are you planning to use the agent? 1. linux 2. windows 3. darwin default choice: [2]: 2 Trying to fetch the default region based on ec2 metadata... Are you using EC2 or On-Premises hosts? 1. EC2 2. On-Premises default choice: [1]: 1 Do you want to turn on StatsD daemon? 1. yes 2. no default choice: [1]: 2 Do you have any existing CloudWatch Log Agent configuration file to import for migration? 1. yes 2. no default choice: [2]: 2 Do you want to monitor any host metrics? e.g. CPU, memory, etc. 1. yes 2. no default choice: [1]: 1 Do you want to monitor cpu metrics per core? 1. yes 2. no default choice: [1]: 2 Do you want to add ec2 dimensions (ImageId, InstanceId, InstanceType, AutoScalingGroupName) into all of your metrics if the info is available? 1. yes 2. no default choice: [1]: 1 Do you want to aggregate ec2 dimensions (InstanceId)? 1. yes 2. no default choice: [1]: 1 Would you like to collect your metrics at high resolution (sub-minute resolution)? This enables sub-minute resolution for all metrics, but you can customize for specific metrics in the output json file. 1. 1s 2. 10s 3. 30s 4. 60s default choice: [4]: 4 Which default metrics config do you want? 1. Basic 2. Standard 3. Advanced 4. None default choice: [1]: 2 Current config as follows: { "metrics": { "aggregation_dimensions": [ [ "InstanceId" ] ], "append_dimensions": { "AutoScalingGroupName": "${aws:AutoScalingGroupName}", "ImageId": "${aws:ImageId}", "InstanceId": "${aws:InstanceId}", "InstanceType": "${aws:InstanceType}" }, "metrics_collected": { "LogicalDisk": { "measurement": [ "% Free Space" ], "metrics_collection_interval": 60, "resources": [ "*" ] }, "Memory": { "measurement": [ "% Committed Bytes In Use" ], "metrics_collection_interval": 60 }, "Paging File": { "measurement": [ "% Usage" ], "metrics_collection_interval": 60, "resources": [ "*" ] }, "PhysicalDisk": { "measurement": [ "% Disk Time" ], "metrics_collection_interval": 60, "resources": [ "*" ] }, "Processor": { "measurement": [ "% User Time", "% Idle Time", "% Interrupt Time" ], "metrics_collection_interval": 60, "resources": [ "_Total" ] } } } } Are you satisfied with the above config? Note: it can be manually customized after the wizard completes to add additional items. 1. yes 2. no default choice: [1]: 1 Do you want to monitor any customized log files? 1. yes 2. no default choice: [1]: 1 Log file path: c:\temp\test.log Log group name: default choice: [test.log] Log stream name: default choice: [{instance_id}] Log Group Retention in days 1. -1 2. 1 3. 3 4. 5 5. 7 6. 14 7. 30 8. 60 9. 90 10. 120 11. 150 12. 180 13. 365 14. 400 15. 545 16. 731 17. 1827 18. 2192 19. 2557 20. 2922 21. 3288 22. 3653 default choice: [1]: 3 Do you want to specify any additional log files to monitor? 1. yes 2. no default choice: [1]: 2 Do you want to monitor any Windows event log? 1. yes 2. no default choice: [1]: 1 Windows event log name: default choice: [System] Do you want to monitor VERBOSE level events for Windows event log System ? 1. yes 2. no default choice: [1]: 2 Do you want to monitor INFORMATION level events for Windows event log System ? 1. yes 2. no default choice: [1]: 2 Do you want to monitor WARNING level events for Windows event log System ? 1. yes 2. no default choice: [1]: 1 Do you want to monitor ERROR level events for Windows event log System ? 1. yes 2. no default choice: [1]: 1 Do you want to monitor CRITICAL level events for Windows event log System ? 1. yes 2. no default choice: [1]: 1 Log group name: default choice: [System] Log stream name: default choice: [{instance_id}] In which format do you want to store windows event to CloudWatch Logs? 1. XML: XML format in Windows Event Viewer 2. Plain Text: Legacy CloudWatch Windows Agent (SSM Plugin) Format default choice: [1]: 2 Log Group Retention in days 1. -1 2. 1 3. 3 4. 5 5. 7 6. 14 7. 30 8. 60 9. 90 10. 120 11. 150 12. 180 13. 365 14. 400 15. 545 16. 731 17. 1827 18. 2192 19. 2557 20. 2922 21. 3288 22. 3653 default choice: [1]: 3 Do you want to specify any additional Windows event log to monitor? 1. yes 2. no default choice: [1]: 2 Saved config file to config.json successfully. Current config as follows: { "logs": { "logs_collected": { "files": { "collect_list": [ { "file_path": "c:\\temp\\test.log", "log_group_name": "test.log", "log_stream_name": "{instance_id}", "retention_in_days": 3 } ] }, "windows_events": { "collect_list": [ { "event_format": "text", "event_levels": [ "WARNING", "ERROR", "CRITICAL" ], "event_name": "System", "log_group_name": "System", "log_stream_name": "{instance_id}", "retention_in_days": 3 } ] } } }, "metrics": { "aggregation_dimensions": [ [ "InstanceId" ] ], "append_dimensions": { "AutoScalingGroupName": "${aws:AutoScalingGroupName}", "ImageId": "${aws:ImageId}", "InstanceId": "${aws:InstanceId}", "InstanceType": "${aws:InstanceType}" }, "metrics_collected": { "LogicalDisk": { "measurement": [ "% Free Space" ], "metrics_collection_interval": 60, "resources": [ "*" ] }, "Memory": { "measurement": [ "% Committed Bytes In Use" ], "metrics_collection_interval": 60 }, "Paging File": { "measurement": [ "% Usage" ], "metrics_collection_interval": 60, "resources": [ "*" ] }, "PhysicalDisk": { "measurement": [ "% Disk Time" ], "metrics_collection_interval": 60, "resources": [ "*" ] }, "Processor": { "measurement": [ "% User Time", "% Idle Time", "% Interrupt Time" ], "metrics_collection_interval": 60, "resources": [ "_Total" ] } } } } Please check the above content of the config. The config file is also located at config.json. Edit it manually if needed. Do you want to store the config in the SSM parameter store? 1. yes 2. no default choice: [1]: 1 What parameter store name do you want to use to store your config? (Use 'AmazonCloudWatch-' prefix if you use our managed AWS policy) default choice: [AmazonCloudWatch-windows] Trying to fetch the default region based on ec2 metadata... Which region do you want to store the config in the parameter store? default choice: [us-east-1] Which AWS credential should be used to send json config to parameter store? 1. ********************(From SDK) 2. Other default choice: [1]: 1 Successfully put config to parameter store AmazonCloudWatch-windows. Please press Enter to exit... |
[戻る]